14 May Revealing the Key Drivers Behind Why Consumers Like What They Like
At IMAGINE, we’re constantly expanding our toolkit with innovative methods that help us unlock deeper consumer insights for our clients. One approach we’ve adopted uses directed graphical models to map the complex web of factors that influence consumer liking.
We know that product preference isn’t shaped by just one thing, it’s an interplay of sensory qualities, claims, emotions, usage situations, and even price. Understanding not only what matters most, but how these factors influence each other, helps to inform product, marketing, and customer initiatives. That’s where directed graphical models come in.
What Are Directed Graphical Models? (And why should we care)
Think of these models as insight maps. They visually show how different attributes are connected and which ones matter most in driving overall preference.
The structure of these models consists of:
- Nodes: representing things like taste, texture, purchase intent, or packaging claims.
- Edges: Arrows showing the direction of influence – if one factor affects another, it’s clearly mapped. For example, if softness leads to higher liking, the model shows that link explicitly.
This lets us see not just correlations but causal pathways – key to making strategic, insight-led decisions.
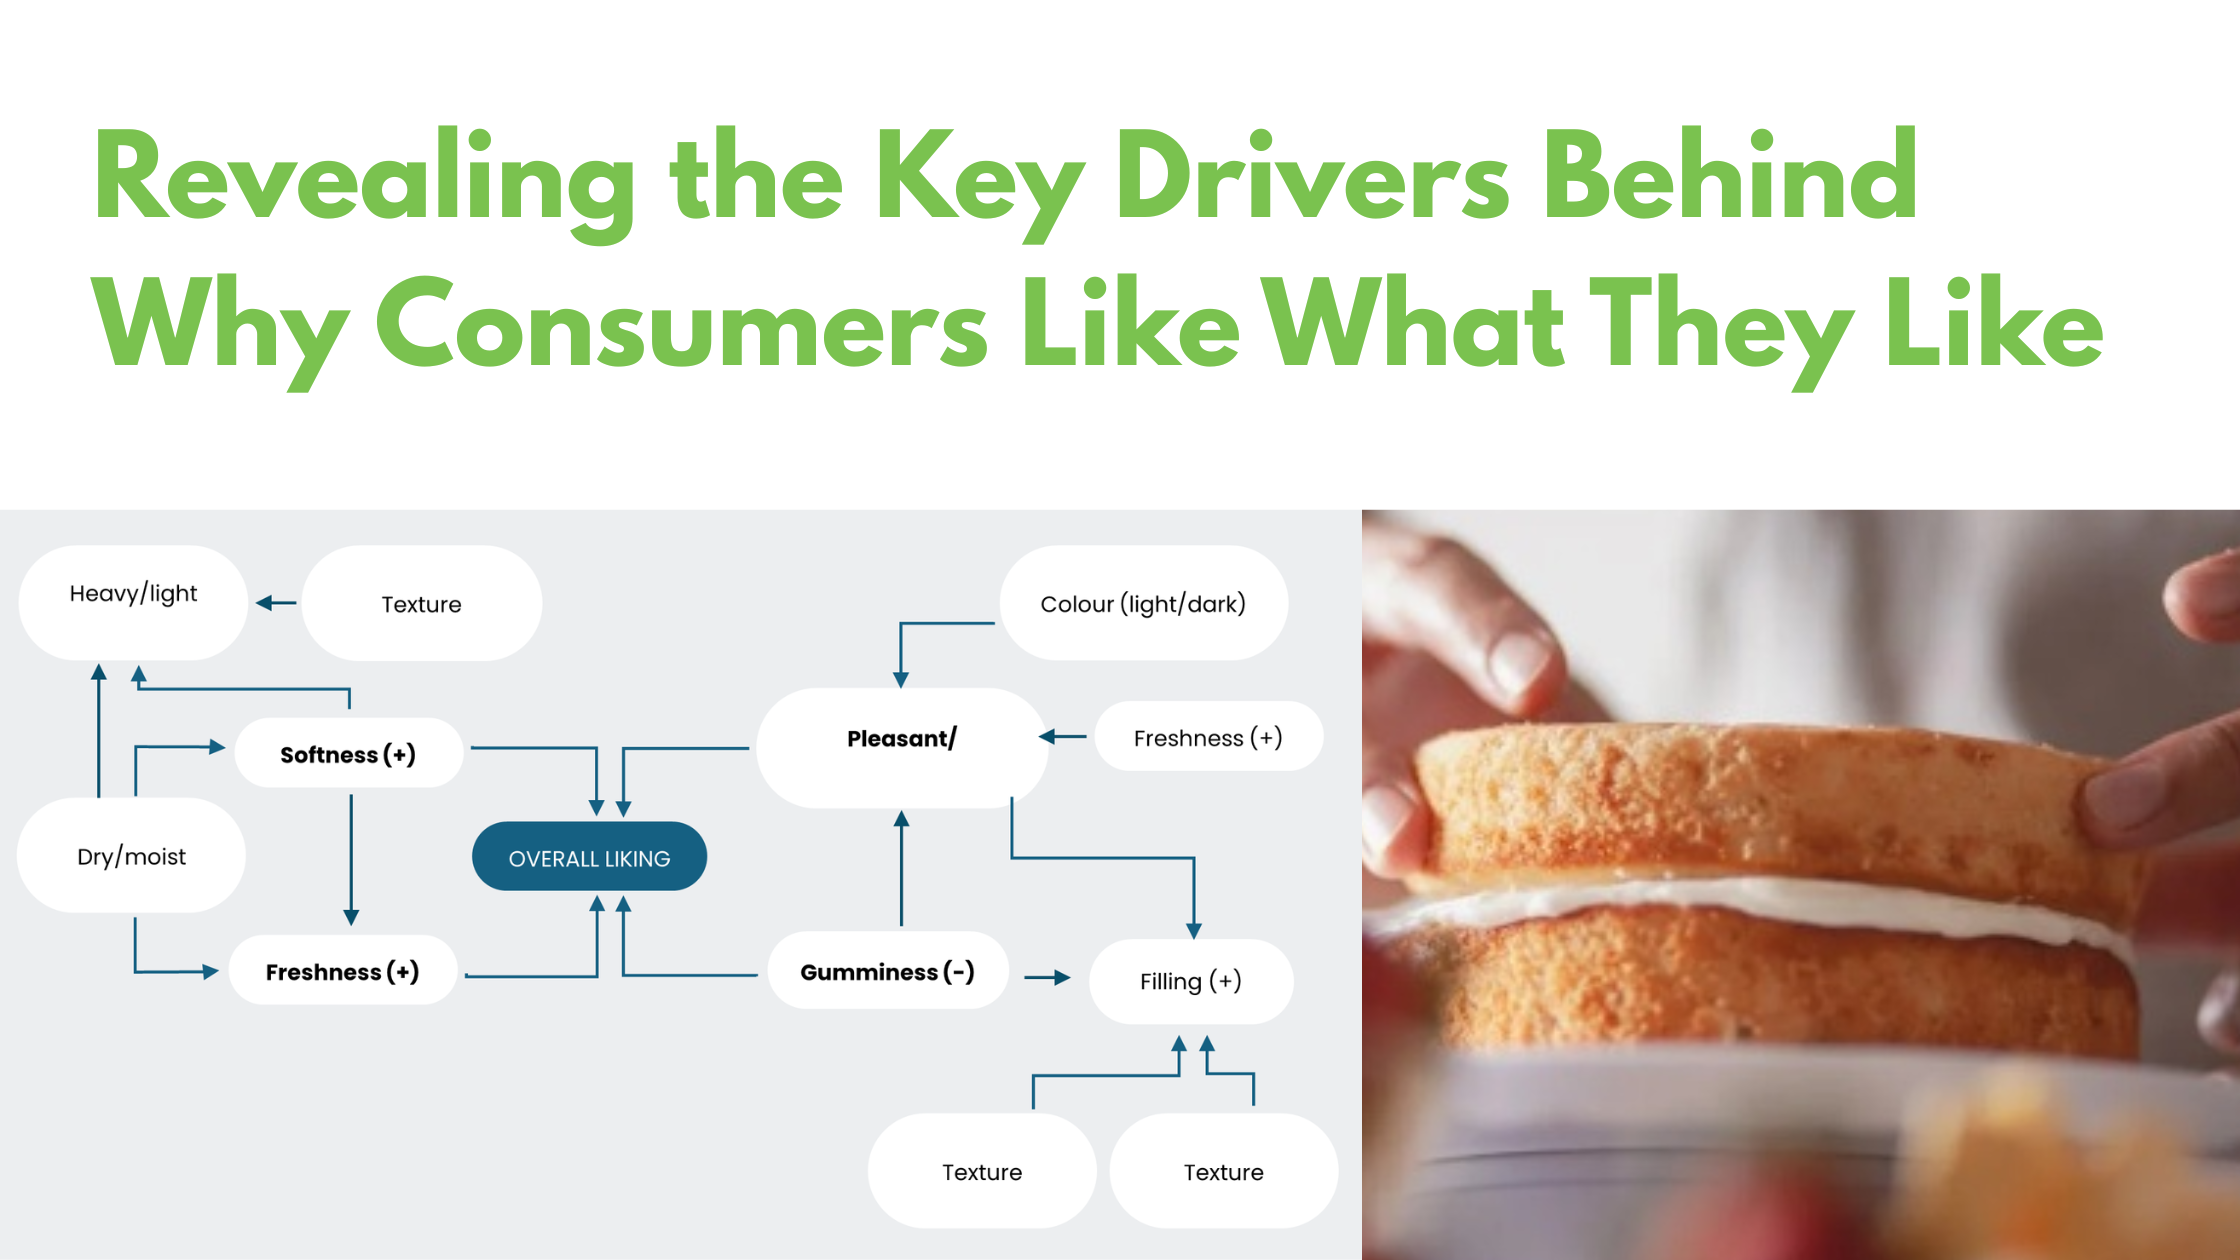
Example case study: Understanding the drivers of an ideal sponge cake
In a recent study, we used a directed graphical model to uncover what makes a sponge cake truly appealing.
Key takeouts:
- Softness, freshness, and a pleasant neutral flavour are the main drivers of overall liking.

- Gumminess, on the other hand, actively reduces appeal.
These insights highlight the importance of balancing preferred qualities like softness and freshness while avoiding negative traits like gumminess.
Beyond this, the model revealed other interesting connections:
- A soft and moist texture signals freshness to consumers.
- A paler colour is associated with a more subtle, pleasant taste.
- Texture issues like gumminess or staleness can negatively impact flavour perception.
These insights help marketers and product teams fine-tune not just the product itself, but how it’s positioned—whether that’s through sensory cues, pack design, or claim hierarchy.
Figure 1: Drivers of overall liking in sponge cake. Note: Actual values have been omitted for this example.
Want to learn more?
We’d love to help you identify the key drivers behind your product’s success! If you’re interested in learning how this analysis can be applied to your specific products, or exploring other potential methods, get in touch with us at info@imagineresearch.co.nz